Overview
For this project, I am employing the Collaborative Filtering technique (Cosine Similarity Algorithm) to recommend new songs to a user based on the song he is listening right now or listened before.
The challenges include: Process JSON data; Transform the data into the right format (model input data, item-user matrix)
Data Explorations
1. Read Data and Look at basice information It’s quite easy to turn the JSON format data into Pandas DataFrame. I wrote a function to do that, and set index, transfering the date data into Pandas DateTime format.
### def load_data(): with open(‘song.json’,’rt’) as inf: data = json.load(inf) data =pd.DataFrame(data) data.set_index(‘id’,inplace=True) data[‘time_played’]=pd.to_datetime(data.time_played) data[‘user_sign_up_date’]=pd.to_datetime(data.user_sign_up_date) return data

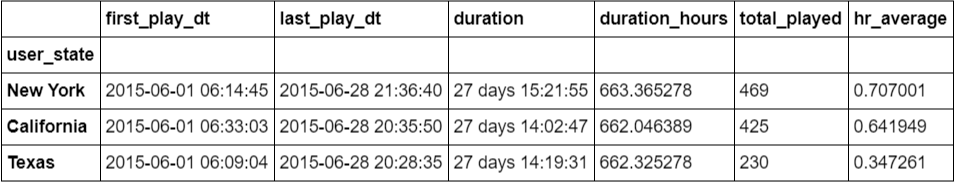
2. Which states have a higher engament than others?
I will define the user engagement here as “the average play event per hour” for a specific state. Then I applied a pre-defined function to the results after Pandas’ groupby function.
### def count_by_state(df): total_played = df.shape[0] first_play_dt = df.time_played.min() last_play_dt = df.time_played.max() duration = last_play_dt - first_play_dt duration_hours = duration.total_seconds()/3600 return pd.Series([first_play_dt,last_play_dt,duration,duration_hours,total_played], index=[‘first_play_dt’,’last_play_dt’,’duration’,’duration_hours’,’total_played’])
counts_by_states = data.groupby('user_state').apply(count_by_state)
counts_by_states['hr_average']= counts_by_states.total_played/counts_by_states.duration_hours
counts_by_states.sort_values(by='hr_average',ascending=False,inplace=True)
Recommendation Model
1. Item-User Matrix
To find the recommended songs, I will turn each song into a vector that is defined by the past user behavior (listened it or not). Then the recommendation problem is transformed into a vector-similarity problem. To build a matrix with each song’s vectore being each row, I resort to Counter() and Pandas’ Cross_tab() separately and both could give me the required matrix: The song_played is as the Index, and all the user_ids are listed as features. Look at the image below, for instance, the song A Day In The Life has been played by user with id 4 three times, thus the value is 3 for the row with Index A Day In The Life and columnd with User_id 4. 
There are two ways I tried to make the above matrix: the first one is using the Counter() function from the collections pachage; the other one is utilizing the pandas’ crosstab function. The realizations are listed below:
### # Counter() method def count_user(df): return pd.Series(Counter(df.user_id)) song_matrix= data.groupby(‘song_played’).apply(count_user).unstack(fill_value=0)
### # crosstab() method pd.crosstab(data[‘song_played’],data[‘user_id’],margins=False)
2. Cosine Similarity For this case, I used Cosine Similarity to find the ‘closeness’ between two songs by calculating their intersection angle.  It has been widely used to get the similarity between Vectors and it is simple to be implemented in Python: for the Item-User Matrix, just normalize it first and then multiply it with the transposed itself.
### song_m_norm = normalize(song_matrix,axis=1) song_cos = song_m_norm.dot(song_m_norm.T) song_rec_m = pd.DataFrame(song_cos,index=song_matrix.index,columns=song_matrix.index)
Application
Find the top 10 recommended songs for a user who is listening the song ‘A Day In The Life’
### def rec(df,song,k): rec_df = df[song].sort_values(ascending=False)[1:k+1].reset_index() return rec_df.rename(columns={‘song_played’: ‘Song’, song: ‘Similarity’}) 